Asset Wealth Index
Have more questions? Contact Vivek Sakhrani
Overview
Atlas AI's Asset Wealth Index (AWI) layer estimates household asset wealth based on asset ownership.
Accurate and comprehensive measurements of economic well-being are fundamental inputs into commerce, research, and policy but such measures are unavailable at a local level in many parts of the world. Our Asset Wealth layer is produced from a deep learning model that predicts survey-based estimates from satellite imagery. To facilitate comparison within and across countries, we transformed Asset Wealth into a normalized index, i.e., a unitless index (a relative measure) centered around zero with both positive and negative values.
Calibration
We calibrate the range of AWI values at a continental level such that, for any given year, the average (mean) AWI value for the entire population of Africa (for that year) is equal to zero. Positive AWI values indicate that the population within a grid cell is more wealthy when compared with the continental average, and negative AWI values indicate a population is less wealthy than average.
Population Weighting
Each raster grid cell’s AWI value represents the average asset wealth for the entire population within that grid cell. To calculate zonal statistics for AWI, therefore, it is necessary to always weight the AWI value of each grid cell within the zone of interest (ZOI) by the size of the population within that grid cell.
For example, if we want to know the average asset wealth for a ZOI comprising two adjacent grid cells, the first of which having a population of 10 and the second having a population of 50, we will need to weight the second grid cell’s AWI value five times more highly than the AWI value of the first grid cell to calculate the zone’s population-weighted mean AWI. The formula to use is:
Comparing relative wealth within a nation
There is no set range of AWI values for each nation. Instead, in order to determine whether a ZOI within a nation is wealthy, average, or poor compared with the nation as a whole, we need to know what the nation’s range of AWI values is (the minimum and maximum AWI indicate the least and most wealthy gridcells) and how the intermediate AWI values are distributed within that range. In other words, we need to examine the population-weighted distribution of AWI values.
One way of quickly visualizing the distribution is to plot a histogram (basically a bar graph with each bar representing a “bin” with an equal portion of the value range and counting the number of values that fall within that portion/bin). The relative ordering of a nation’s AWI value bins makes it easy to compare the relative wealth of different ZOIs within the nation.
Below are histograms visualizing the distributions of Asset Wealth of the Democratic Republic of Congo (DRC) weighted by Population for the years 2015–2020. The x-axes (the bars' widths) represent the range of AWI values corresponding with each bar and the y-axes (the bars' heights) represent the counts of people whose mean AWI value falls within those portions.
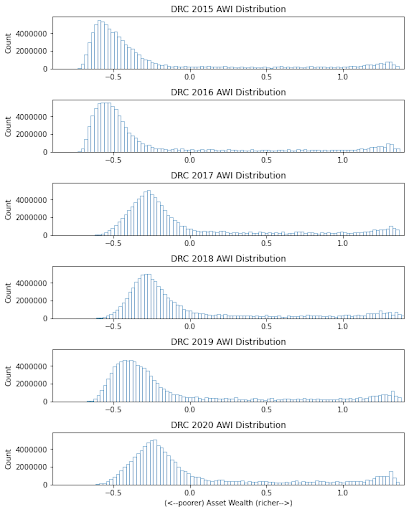
Once we know what the distribution of AWI values looks like for DRC, we can determine the relative wealth for any given ZOI (or grid cell) by comparing its (population weighted) mean Asset Wealth with the country's distribution. The further to the right a zone’s mean AWI value falls on the x-axis, the richer it is relative to DRC as a whole.
Methods
For details on methods, input data sources, validation, and background citations, please consult:
https://docs.atlasai.co/economic%20well-being/asset_wealth/
Version information
This data is available in multiple versions in raster format and is updated annually for several geographic regions.
Version 2022
Data type: Float64
No-data value: 1.79769e+308
Index mean: 0
Min/max values: -3.7540488468307975 (min), 9.403622612118921 (max)
Time horizon: 2003–2021
Spatial representation: Raster grid
Spatial resolution: 1km x 1km
Extent: 43 countries in Sub-Saharan Africa
(Angola,
Burundi,
Benin,
Burkina Faso,
Botswana,
Central African Republic,
Côte d'Ivoire,
Cameroon,
Democratic Republic of the Congo,
Republic of the Congo,
Eritrea,
Ethiopia,
Gabon,
Ghana,
Guinea,
The Gambia,
Guinea-Bissau,
Equatorial Guinea,
Kenya,
Liberia,
Lesotho,
Madagascar,
Mali,
Mozambique,
Mauritania,
Malawi,
Namibia,
Niger,
Nigeria,
Rwanda,
Senegal,
Sierra Leone,
Somalia,
South Sudan,
Sudan,
Eswatini,
Chad,
Togo,
Tanzania,
Uganda,
South Africa,
Zambia,
Zimbabwe)
National boundaries source: geoBoundaries
Version 2022 (beta)
Data type: Float32
No-data value: 3.40282e+38
Index mean: 0
Min/max values: -3.090599 (min), 6.473511 (max)
Time horizon: 2015–2021
Spatial representation: Raster grid
Spatial resolution: 1km x 1km
Extent: Six countries in South Asia
(Bangladesh,
Bhutan,
India,
Nepal,
Pakistan,
Sri Lanka)
National boundaries source: geoBoundaries and Natural Earth (India POV)
Version 2021
Data type: Float32
No-data value: -99999
Index mean: 0
Min/max values: -1.0113611 (min), 2.0468638 (max)
Time horizon: 2003–2020
Spatial representation: Raster grid
Spatial resolution: 2km x 2km
Extent: Sub-Saharan Africa
Version compatibility
Version 2022 and Version 2022 (beta) have a higher spatial resolution (1km x 1km) than Version 2021 (2km x 2km). Version 2022 and Version 2022 (beta) are therefore incompatible with Version 2021.
Code samples
Below are two code samples for, first, generating color maps to display AWI data in Python and, second, calculating zonal statistics (mean AWI) for an area of interest in Python.
Generate AWI color maps
import numpy as np
from matplotlib import colors


def hex2color_map(name, hex_list):
    color_tuples = list(map(_parse_hex, hex_list))
    color_tuples_normalized = [
        (e[0] / 255.0, e[1] / 255.0, e[2] / 255.0, 255.0) for e in color_tuples
    ]
    cmap = normalized_color_tuples2cmap(color_tuples_normalized)
    save_cmap(name, cmap)


def save_cmap(name, cmap):
    cmap_vals = cmap(np.linspace(0, 1, 255))
    cmap_uint8 = (cmap_vals * 255).astype("uint8")

    np.save(name + "_rgba.npy", cmap_uint8)


def normalized_color_tuples2cmap(color_tuples_normalized, interpolate=True):
    if not interpolate:
        # No color interpolation:
        return colors.ListedColormap(color_tuples_normalized, "woooooooooooo")

    ### With color interpolation:
    nc = len(color_tuples_normalized)
    c = np.zeros((3, nc, 3))
    rgb = ["red", "green", "blue"]
    for idx, e in enumerate(color_tuples_normalized):
        for ii in range(3):
            c[ii, idx, :] = [float(idx) / float(nc - 1), e[ii], e[ii]]

    cdict = dict(zip(rgb, c))
    cmap = colors.LinearSegmentedColormap("woooooooooooo", cdict)
    return cmap


def _parse_hex(color_code):
    return (
        int(color_code[1:3], 16),
        int(color_code[3:5], 16),
        int(color_code[5:7], 16),
    )


hex2color_map(
    "AtlasAI_Asset_Wealth",
    [
        "#f1f558",
        "#e9d361",
        "#ddb369",
        "#cd946f",
        "#b97776",
        "#a05b7b",
        "#834182",
        "#5d2b88",
        "#131b90",
    ],
)
Calculate zonal statistics
import rasterio as rio
import geopandas as gpd
from rasterstats import zonal_stats

# convert boundaries file crs to raster crs (epsg:3857) and save as boundaries-3857.gpkg
gdf = gpd.read_file('boundaries.geojson')
gdf.to_crs(3857).to_file('boundaries-3857.gpkg')

# population-weight awi by multiplying awi and pop pixel values and save as POP-weighted-AWI_Country_YYYY.tif
with rio.open('AWI_Country_YYYY.tif') as src:
    awi = src.read(masked=True)
    profile = src.profile

with rio.open('POP_Country_YYYY.tif') as src:
    pop = src.read(masked=True)

awi = awi.astype('float128') #<--prevent 'RuntimeWarning: overflow encountered in multiply'
pop_weighted_awi = awi * pop

with rio.open('POP-weighted-AWI_Country_YYYY.tif', 'w', **profile) as dst:
    dst.write(pop_weighted_awi)

# calculate zonal statistics (sum) for population and awi
pop_weighted_awi_sum = zonal_stats("boundaries-3857.gpkg",
                                   "POP-weighted-AWI_Country_YYYY.tif",
                                   stats='sum')

pop_sum = zonal_stats("boundaries-3857.gpkg",
                      "POP_Country_YYYY.tif",
                      stats='sum')

# calculate the (population weighted) mean awi by dividing the population-weighted awi sum by the population sum
pop_weighted_mean_awi = pop_weighted_awi_sum[0]['sum'] / pop_sum[0]['sum']